
Plotting a Simple Line Graph with Matplotlib
Plotting a Simple Line Graph with Matplotlib
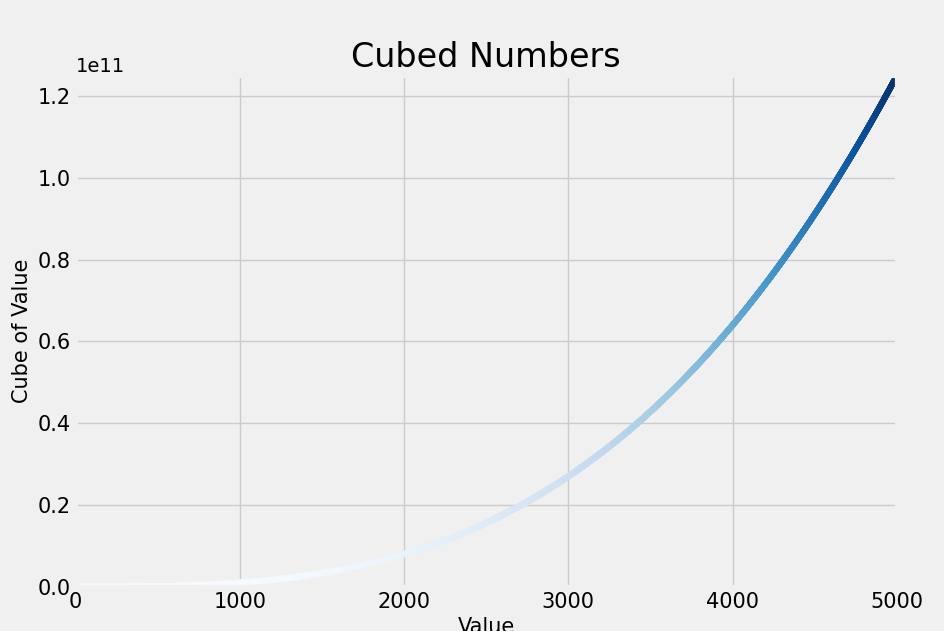
Demonstrates use of Python and Matplotlib, a mathmatical plotting library to create a line graph.
Python Code Block:
import matplotlib.pyplot as plt

x_values = range(1, 5000)
y_values = [x**3 for x in x_values]

# styles figure
plt.style.use('fivethirtyeight')

# function generates plots in the same figure
fig, ax = plt.subplots()
# fig represents the entire figure
# ax represents a single plot within the figure
ax.scatter(x_values, y_values, c=y_values, cmap=plt.cm.Blues, s=15)

# Set titles
ax.set_title('Cubed Numbers', fontsize=24)
ax.set_xlabel('Value', fontsize=15)
ax.set_ylabel('Cube of Value', fontsize=15)
ax.tick_params(axis='both', which='major', labelsize=15)

# Define range of axes
ax.axis([0, 5000, 0, 125000000000])

# Open figure in Matplotlib's viewer
plt.show()
Output to Matplotlib’s Viewer: