
Random Walk with Matplotlib
Random Walk Data Visualization with Matplotlib
The goal of this post is to walk you through using a random walk to create the plot points for a visualization representing a piece of pollen’s floating on water.
Random Walk Class
It all starts with a RandomWalk() Class that we can reuse for each visualiztion.
from random import choice

class RandomWalk:
    """A class to generate random walks."""

    def __init__(self, num_points=5000):
        self.num_points = num_points

        # All walks start at (0,0).
        self.x_values = [0]
        self.y_values = [0]

    def fill_walk(self):
        """Calculate points in a random walk."""

        # Keep taking steps until the walk reaches the desired length.
        while len(self.x_values) < self.num_points:

            # Decide which direction and how far to go.
            x_direction = choice([1, -1])
            x_distance = choice([0, 1, 2, 3, 4, 5])
            x_step = x_direction * x_distance

            y_direction = choice([1, -1])
            y_distance = choice([0, 1, 2, 3, 4, 5])
            y_step = y_direction * y_distance

            # Reject moves that go nowhere.
            if x_step == 0 and y_step == 0:
                continue

            # Calculate the new position.
            x = self.x_values[-1] + x_step
            y = self.y_values[-1] + y_step

            # Append the values.
            self.x_values.append(x)
            self.y_values.append(y)
Pollen Plot 1: Simple
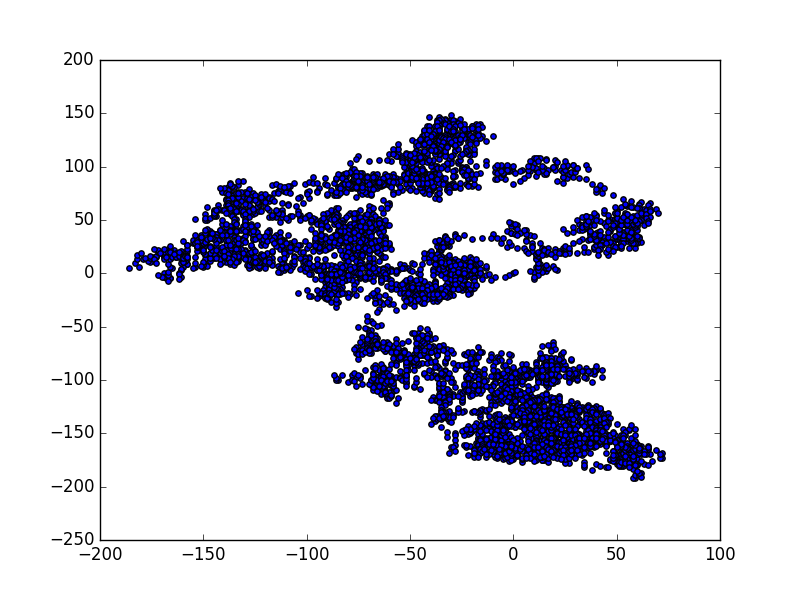
Now that we have our class, it’s time to instantiate an object from that class and visualize it’s path.
import matplotlib.pyplot as plt

from random_walk import RandomWalk

# Make a random walk.
rw = RandomWalk()
rw.fill_walk()

plt.style.use('classic')

fig, ax = plt.subplots()
ax.scatter(rw.x_values, rw.y_values, s=15)
plt.show()
Output: